From plus-minus to net rating: what the newer number fixed, and what it lost
Raw plus-minus answers a question nobody asked. Net rating answers a better one. Neither tells you whether a player was good.
Plus-minus arrived in basketball from hockey, where it had been doing roughly the same job badly for decades. The idea is irresistibly simple: while this player was on the floor, his team outscored the opponent by this much. No judgement, no model, nothing to argue with. That simplicity is also the problem, and the sequence of numbers built to repair it is a short and instructive history of what a statistic can and cannot fix.
Raw plus-minus answers a question nobody asked
The raw figure tells you what happened while a player was on the floor. It does not tell you what he did, and it cannot distinguish his contribution from the contributions of the four people next to him and the five people opposite.
The consequences are not subtle. A reserve who plays most of his minutes alongside the starters will post a figure that mostly describes the starters. A starter on a weak team who sits only when the game is already decided can finish a strong individual season with a dismal plus-minus. Playing time distribution — who you share the floor with, and when — can dominate the number entirely, and none of that is a property of the player.
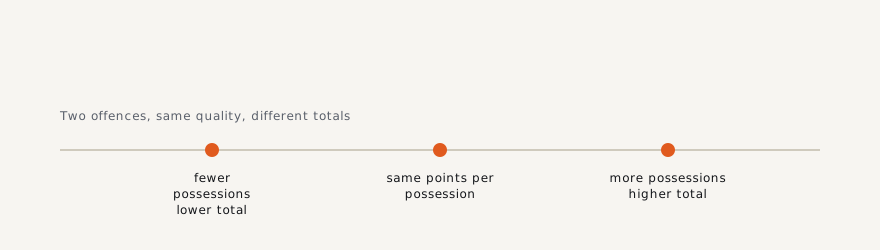
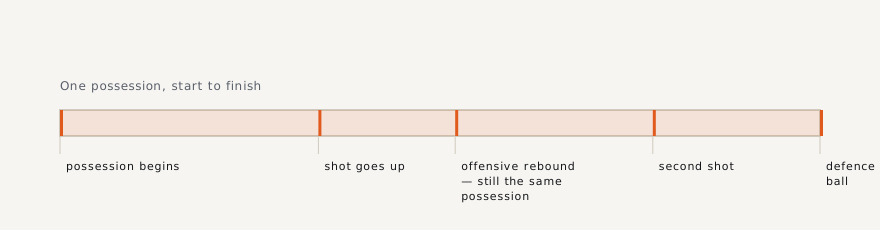
It is also hostage to pace. Two players who improve their teams by identical amounts will post different raw figures if one of their teams plays faster, because a faster team runs more possessions through the same minutes.
First repair: divide by possessions
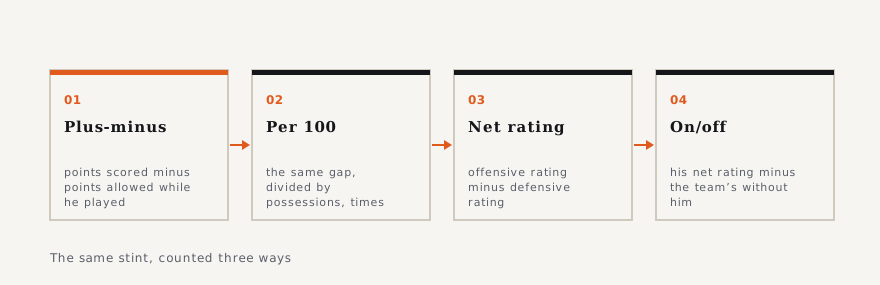
The first fix is the same one that fixes team totals. Stop counting the gap per game or per minute and count it per possession, usually scaled to a hundred possessions so the numbers land in a readable range. Pace disappears from the comparison. The player who improved his team by the same amount now reads the same whether his team ran or walked.
This does nothing at all about teammates, which is the larger problem.
Second repair: split the two halves
Net rating is the per-possession gap expressed as two numbers rather than one: an offensive rating, which is points the team produced per hundred possessions with this player on the floor, and a defensive rating, which is points it allowed. The difference is the net.
Splitting it is a genuine gain in information, because the two halves can point in opposite directions and a single number hides that. A player can be a clear positive on one end and a clear negative on the other, and the net figure that averages them describes nobody. Anyone who has watched a team try to decide whether to play a particular big man in a particular series has watched that split being argued about.
Third repair: compare against the alternative
The question a coach actually has is not "how did the team do with him" but "how did it do with him compared with without him". That is the on/off figure: his net rating minus the team's net rating when he is on the bench.
This is the closest any of these numbers get to the real question, and it is also the noisiest, because it is a difference between two samples that are each smaller than the whole. Bench minutes are not a random sample of the season either — they are the minutes a coach chose to rest him, which tend to cluster in specific game situations. An on/off figure over a few games is close to meaningless. Over a season it is suggestive. Over a career it starts to be evidence.
What got lost along the way
Each repair bought precision by spending transparency. Raw plus-minus is checkable with a pencil from the play-by-play. Per-possession figures depend on an estimated possession count. On/off depends on how a coach happened to distribute minutes. The further up the ladder you go, the more of the number is produced by decisions somebody made about how to count rather than by things that happened on a floor.
And none of them, at any rung, tells you whether a player was good. They tell you what the scoreboard did around him, adjusted for a steadily longer list of confounders. The confounder that no version of plus-minus removes is the one that matters most: the quality of everyone else on the floor. The regression-based versions of these numbers exist precisely to attack that, and they attack it by building a model, which trades a counting problem for a modelling problem.
How to read any of them
Ask three questions. Over how many possessions. With whom. Against whom. A plus-minus family number that arrives without at least an implicit answer to all three is not a measurement; it is a mood. With those three answered, the net-rating split and the on/off difference are among the most useful things available about a player who does not score, and that is their real contribution: they made it possible to argue about defence with something other than adjectives.